Divide the rational expression: 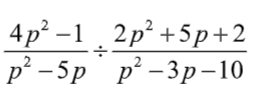
a. 
b. 
c. 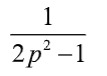
d. 
a.
You might also like to view...
First, create a scatter plot for the data in the table. Then, use the shape of the scatter plot given to determine if the data are best modeled by a linear function, an exponential function, a logarithmic function, or a quadratic function.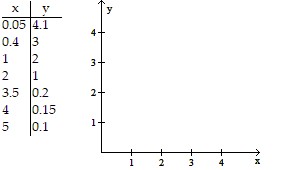
A. 
exponential function
B. 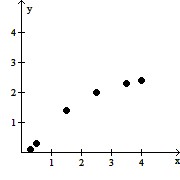
logarithmic function
C. 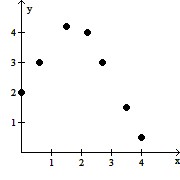
quadratic function
D. 
linear function
Answer the following statement(s) true (T) or false (F)
Curricula that utilize guided investigation aim to have students re-invent all of the mathematics they need to learn on their own.
Solve the problem.In a certain apportionment problem, State X has a standard quota of 73.9. The final apportionment to State X is 72 seats. This is called
A. the population paradox. B. the Alabama paradox. C. a lower-quota violation. D. an upper-quota violation. E. none of these
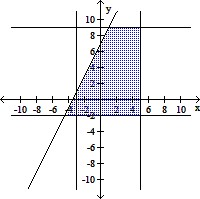
Graph the system of inequalities.-3 < x < 5-2 ? y ? 9y - 2x ? 7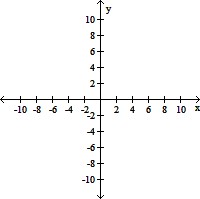
A. 
B. 
C. 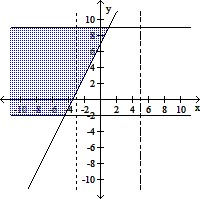
D.