You would use a ______ to illustrate the data in this frequency distribution table because the variable is measured at the ______ level of measurement
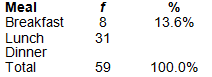
a. frequency polygon; ordinal
b. bar chart; nominal
c. histogram; interval
d. pie graph; ratio
b. bar chart; nominal
You might also like to view...
Describe Piaget’s ideas of assimilation, accommodation, and equilibration.
What will be an ideal response?
Explain why your relationship with the child and your relationship with the family are critically important in your promotion of children's social competence and emotional well-being. Describe three strategies for establishing strong relationships with children and three strategies for enhancing relationships with families
What will be an ideal response?
The A-B-A-B design is superior to A-B or A-B-A designs for all of these reasons EXCEPT:
A. issues of prediction, verification, and replication are strengthened. B. it controls threats to internal validity. C. it controls threats to reliability. D. it ends with the treatment phase in effect.
Error analysis in mathematics that includes the "diagnostic interview" involves gathering background information about the student
Indicate whether the statement is true or false