Use the circle graph to solve the problem.The circle graph below gives the inventory of the men's department of a store.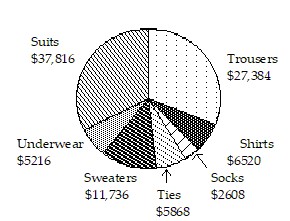 In which item of apparel does the store have the smallest investment?
A. Underwear
B. Suits
C. Shirts
D. Socks
Answer: D
You might also like to view...
The result of a hypothesis is described in terms of the probability of obtaining a particular sample. Use the given context to formulate the null and alternative hypotheses. Discuss whether the sample provides evidence for rejecting the null hypothesis.A company claims that the proportion of defectives among its new DVD players is only 0.01 (1%). A consumer group believes that the proportion of defectives is higher than this. The consumer group picks a random sample of 200 of the DVD players and finds the proportion of defectives in the sample to be 0.022. Assuming that the proportion of defectives for all the company's DVD players is p = 0.01, the probability of selecting a sample in which the proportion of defectives is 0.022 or more is 0.044.
What will be an ideal response?
Use a graphical method to solve the system. Give x- and y-coordinates correct to the nearest hundredth.y = e2x + 32x + y = 3
A. (-0.75, -4.50) B. (0.75, -4.50) C. (0.75, 4.50) D. (-0.75, 4.50)
Find the equation that the given graph represents.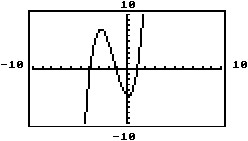
A. P(x) = x3 + 4x2 - x - 5 B. P(x) = x5 + 4x3 - x2 + 3x - 5 C. P(x) = x3 + x2 + x + 5 D. P(x) = -x3 + 4x2 + x - 5
Simplify the expression.(-9)(-9)
A. -81 B. 81 C. 91 D. 162