Exhibit 2-3 Production possibilities curve data
A
B
C
D
E
Capital goods 0
1
2
3
4
Consumer goods20
18
14
8
0
According to the data given in Exhibit 2-3, the production of 1 unit of capital goods and 20 units of consumer goods:
A. is possible but would be inefficient.
B. may be a result of unemployment.
C. may be a result of unused natural resources.
D. is not feasible with current resources and technology.
Answer: D
You might also like to view...
What is the future value of $1 (i) after 18 years if the interest rate is 4 percent, (ii) after 12 years if the interest rate is 6 percent, (iii) after 9 years if the interest rate is 8 percent, and (iv) after 6 years if the interest rate is 12
percent?
The monopolist chooses to produce:
A. where marginal cost equals marginal revenue. B. at a higher quantity than the perfectly competitive firm. C. at an efficient outcome. D. at a cost that is equal to a competitive one.
Gross fiscal expenditure in a country increased by $100,000 during a certain year. If the marginal propensity to save is 0.5, then real GDP in this country has increased by: a. $125,000. b. $50,000
c. $200,000. d. $100,000.
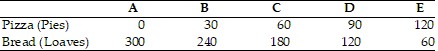 The above table shows the daily production possibilities for a bakery. Currently the bakery bakes 60 pizzas and 180 loaves of bread, that is at alternative C.Using the above table, what is the opportunity cost of moving from alternative C to alternative D?
A. 30 loaves of bread B. 60 loaves of bread C. 1/2 loaf of bread D. 2 loaves of bread