Based on this graph, the year with the highest surplus took place in the ______.
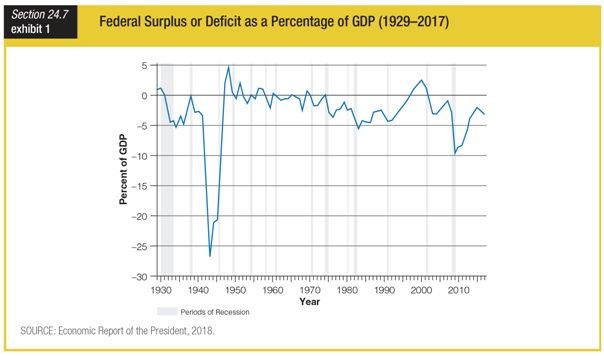
a. 1940s
b. 1970s
c. 1990s
d. 2000s
a. 1940s
You might also like to view...
An increase in the money supply would cause the FE line to
A) shift to the right. B) shift to the left. C) remain unchanged. D) remain unchanged if Ricardian equivalence holds; otherwise, shift to the right.
The ratio of the burden of the tax borne by demanders to the burden of the tax borne by suppliers will be equal to_____
a. the square of the slope of the demand curve b. the elasticity of demand times the elasticity of supply c. the ratio of the absolute values of the slopes of the demand curve and the supply curve d. the sum of the elasticities of the inverse demand curve and the supply curve
The value of money rises as the price level
a. rises, because the number of dollars needed to buy a representative basket of goods rises. b. rises, because the number of dollars needed to buy a representative basket of goods falls. c. falls, because the number of dollars needed to buy a representative basket of goods rises. d. falls, because the number of dollars needed to buy a representative basket of goods falls.
If the farmer is producing 5000 bushels of soybeans at point B in the figure above, we know that
A) the farmer is not using his resources efficiently. B) the farmer is using his land to produce a crop other than soybeans or corn. C) the farmer must be using more land than was used in constructing the production possibilities curve. D) the farmer is using his resources efficiently.