The table above gives the values of different expenditures in the United States during 1999. Answer the following questions about the United States
a. What was the value of net exports of goods and services in 1999?
b. What was (nominal) GDP equal to in 1999?
c. What was the (nominal) value of total production equal to in 1999?
a. Net exports of goods and services equals the value of exports of goods and services, $998 billion, minus the value of imports of goods and services, $1,252 billion, or -$254 billion.
b. GDP equals the sum of consumption expenditure, $6,258, plus investment, $1,623, plus government expenditure on goods and services, $1,630, plus net exports, -$254, or $9,257 billion.
c. The value of total production equals the value of GDP, so total production was $9,257 billion in 1999.
You might also like to view...
Use the following graph to answer the next question.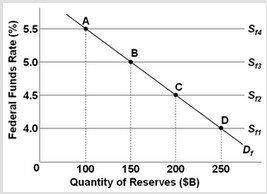 If demand for overnight funds in the graph should increase by $50 billion at each and every point on the demand curve, but the Federal Reserve wants to keep the target rate at 5.0%, what will be the new equilibrium quantity of reserves?
A. $200 billion B. $100 billion C. $150 billion D. $250 billion
Suppose the price of copper and the quantity of copper both rose at the same time. Whatmight be the likely explanation of this using supply and demand analysis?
What will be an ideal response?
Which of the following is true of leakages and injections in the circular flow model? a. Leakages minus injections equal gross domestic product (GDP)
b. Injections minus leakages equal gross domestic product (GDP). c. Leakages minus injections equal zero in equilibrium. d. Leakages must be less than injections for an economy to be in equilibrium. e. Leakages must be greater than injections for an economy to be growing.
Refer to the information provided in Figure 3.11 below to answer the following question(s).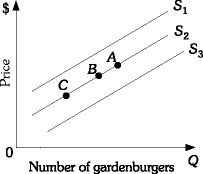 Figure 3.11Refer to Figure 3.11. A decrease in the price of mushrooms (an input for gardenburgers) will cause a movement from Point B on supply curve S2 to
A. supply curve S3. B. Point C on supply curve S2. C. supply curve S1. D. Point A on supply curve S2.