When average total cost is declining, then
A. marginal cost must be less than average total cost.
B. marginal cost must be greater than average total cost.
C. average total cost must be greater than average fixed cost.
D. average variable cost must be declining.
A. marginal cost must be less than average total cost.
You might also like to view...
On account of a massive construction boom in a country, the demand for iron ore increases substantially. This causes iron ore prices to escalate. Producers increase iron ore mining considerably in the short run, in spite of knowing that this will adversely affect future availability of ore. Which of the following is most similar to the scenario described above?
a. Corn producers hoard their supplies in order to induce a price hike. b. Petroleum manufacturers increase extraction in response to sky-rocketing fuel prices. c. The government of a country makes aforestation mandatory for lumber firms. d. Impressive revenue generation induces the government of a country to impose additional fuel surcharge. e. To discourage smoking, the government of a country increases sales tax on cigarettes.
In a price leadership situation, where one firm sets a price for others to follow, the leading firm is the one with the
a. largest market share b. highest quality good c. most elastic demand curve d. least elastic demand curve e. most efficient production
A consulting company estimated market demand and supply in a perfectly competitive industry and obtained the following results:Qd = 25,000 ? 5,000P + 25MQs = 240,000 + 5,000P ? 2,000PIwhere P is price, M is income, and PI is the price of a key input. The forecasts for the next year are  = $15,000 and
  I = $20. Average variable cost is estimated to beAVC = 14 ? 0.008Q + 0.000002Q2Total fixed cost will be $6,000 next year. Suppose that income for next year is forecasted to be $9,000 instead. What is the profit-maximizing output choice for the firm?
A. 2,000 units B. 1,000 units C. 2,860 units D. 1,860 units E. none of the above
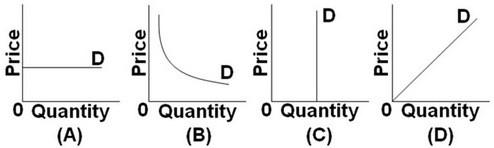 Refer to the above graphs. Which shows a perfectly elastic demand curve?
A. Graph A B. Graph B C. Graph C D. Graph D