 Refer to the above graphs. Which shows a perfectly elastic demand curve?
A. Graph A
B. Graph B
C. Graph C
D. Graph D
Answer: A
You might also like to view...
Figure 36-5
?
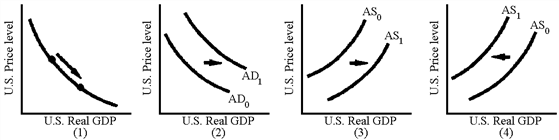 Which of the graphs in Figure 36-5 are consistent with an appreciation of the U.S. dollar caused by an increase in U.S. interest rates?
A. 1 B. 2 C. 3 D. 4
An increase in a country's capital stock relative to its work force is known as
A) capital improvement. B) capital augmentation. C) capital growth. D) capital deepening.
The table above shows how the number of books Katie buys each year depends on her income
a) What kind of relationship exists between Katie's income and the number of books she purchases? b) Plot the relationship between Katie's income and the number of books she purchases in the above figure. Measure income along the vertical axis and the number of books along the horizontal axis. Be sure to label the axes. c) What is the slope of the relationship between $50,000 and $70,000 of income? d) What is the slope of the relationship between $90,000 and $110,000 of income? e) Comment on the similarity or dissimilarity of your answers to parts (c) and (d).
Amy discovers a way to produce water heaters so they are less expensive and use less natural gas. Amy's discovery is
a. physical capital. If Amy's discovery leads to lower natural gas prices, it has made natural gas less scarce. b. physical capital. If Amy's discovery leads to lower natural gas prices, it has made natural gas scarcer. c. technological knowledge. If Amy's discovery leads to lower natural gas prices, it has made natural gas less scarce. d. technological knowledge. If Amy's discovery leads to lower natural gas prices, it has made natural gas scarcer.