Simplify.

A. 
B. - 
C. 
D. 
Answer: A
You might also like to view...
Plot the graph of the regression line for the following table of values. x 1.16 3.75 4.55 6.93 y 16.27 10.79 9.08 4.43
What will be an ideal response?
Solve the problem.The paired data below consist of the temperatures on randomly chosen days and the amount a certain kind of plant grew (in millimeters). By using linear regression, the following function is obtained:  where x is temperature and y is growth in millimeters. Use this function to predict the growth of a plant if the temperature is 67.
A. 27.78 B. 29.81 C. 27.33 D. 29.27
Graph the function.f(x) = 
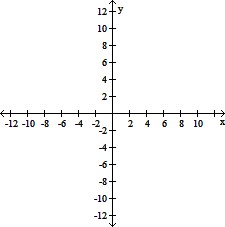
A. 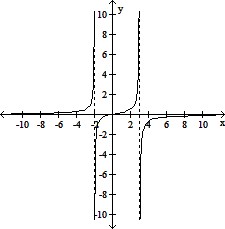
B. 
C. 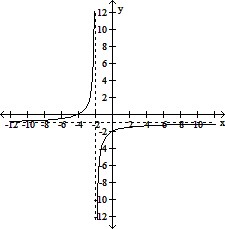
D. 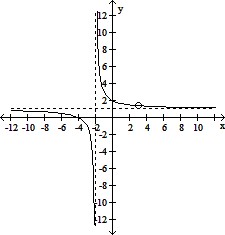
Solve the problem.The following graph shows a weight and height chart. The weight w is listed in pounds and the height h in inches. The shaded area is a recommended region. 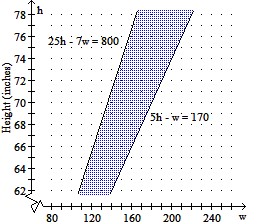 Weight (pounds)What does this chart indicate about an individual who weighs 140 pounds and is 73 inches tall?
A. This individual's weight falls within the recommended region for his or her height. B. There is not enough information given. C. This individual weighs more than recommended for his or her height. D. This individual weighs less than recommended for his or her height.