Suppose the market demand curve is given by Qd = 80 - 10P, and the market supply curve is given by Qs = 10 + 15P. What is the equilibrium price and quantity?
A. P* = $2.80 and Q* = 54
B. P* = $2.80 and Q* = 52
C. P* = $2.60 and Q* = 54
D. P* = $3.00 and Q* = 55
Answer: B
You might also like to view...
On the risk side of the analysis, your team reviews the following data from the risk assessment process. Interpret each of these quantitative findings about pesticide risk, by stating precisely what the numerical value(s) mean or imply in each case. Be specific. (i) Pesticide W: Reference Dose (RfD) = 0.005 (ii) Pesticide X: threshold level of 0 for infants and children (iii) Pesticide Y: carcinogenic risk of 0.0075 percent (iv) Pesticide Z: a dose (D)-response (R) function modeled as R = 0 for all D < 0.6, R = – 0.3 + 0.5D for all D ? 0.6.
Suppose you are part of an economic analysis team charged with recommending a policy response to pesticide risks. Your team decides to use risk-benefit analysis as its risk management strategy.
Proponents of Fed independence maintain that
a. independence helps ensure low unemployment rates. b. money is too important to be left to the bankers. c. independence permits objective decisions not based on politics. d. only the Federal Reserve knows how to act wisely.
Exhibit 4-3 Supply and demand curves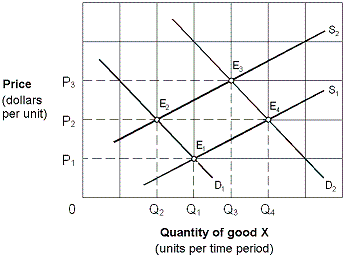 Beginning from an equilibrium at point E2 in Exhibit 4-3, an increase in demand for good X, other things being equal, would move the equilibrium point to:
A. E1. B. E2. C. E3. D. E4.
In a market system, the distribution of goods and services among consumers is largely determined by:
A. The willingness and ability of consumers to pay the prices B. Whoever needs the goods and services the most C. Whoever has the closest connection to firms and the government D. A random factor that is almost impossible to predict