Graph the polynomial function. f(x) = -x2(x - 1)(x + 3)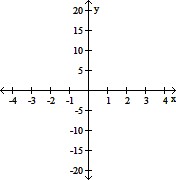
A. 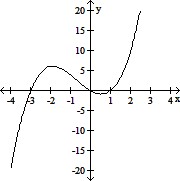
B. 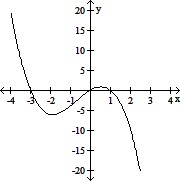
C. 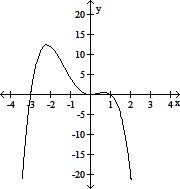
D. 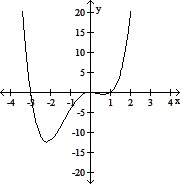
Answer: C
You might also like to view...
The following data show the number E of elk in a national park t years after 2000. t 0 2 4 5 7 E 3,170 5,531 7,230 9,941 10,430? A: Use logistic regression to model E as a function of t.B: Plot the graph of the data along with the model you found in part A.C: According to the model, what is the carrying capacity for elk in this park?D: When did the elk population reach 90.00% of carrying capacity? ? Round your answers to two decimal places, if necessary.
What will be an ideal response?
Use transformations to graph the function. Determine the domain, range, and the equation of the horizontal asymptote of the function.f(x) = 2(x - 1)
A. domain: (-?, ?); range:(-?, 0)
horizontal asymptote: y = 0
B. domain: (-?, ?); range:(-?, 0)
horizontal asymptote: y = 0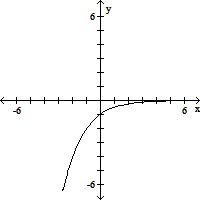
C. domain: (-?, ?); range:(0, ?)
horizontal asymptote: y = 0
D. domain: (-?, ?); range:(0, ?)
horizontal asymptote: y = 0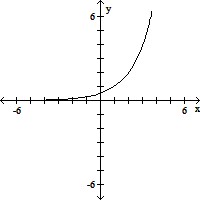
Find all the zeros of the function. ? x(x - 5)2 ?
A. 0, 5 B. 1, 5 C. ±5 D. 1, -5 E. 0, -5
Determine whether the statement is true or false. To find the steady-state distribution vector X, we solve the system
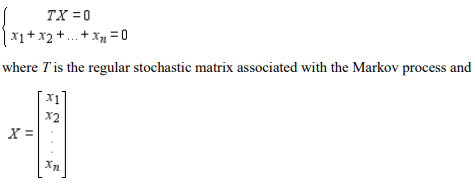
a. false
b. true