Solve the problem.During a drought, the water level in a river dropped 4 inches each day for 8 straight days. What was the change in the water level of the river during this this period?
A. -12 inches
B. 32 inches
C. -32 inches
D. 12 inches
Answer: C
You might also like to view...
Provide an appropriate response. Shortly before a mayoral election, a market research firm took a poll to find out which candidate people were planning to vote for. The results are shown below.  Li Fong2120Bob Green2329Sue Moore1042Jose Alvarez399You wish to construct a graph to represent the data. It should be easy to see from your graph which candidate is in the lead. Which graph would be more useful, a bar graph or a pie chart? Explain your thinking.
What will be an ideal response?
Provide an appropriate response.Find the area of the lattice polygon.
A. 7 B. 9 C. 8 D. 10
Determine the direction angle for the vector. Round to the nearest tenth of a degree.v = -4i - 3j
A. none of these B. 36.9° C. 233.1° D. 216.9°
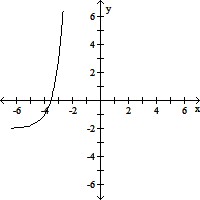
Graph the function.y = 5(x - 4) + 2
A. 
B. 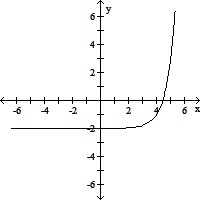
C. 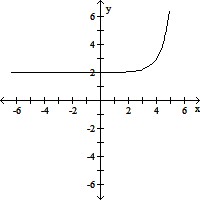
D.