Use the imaginary unit to write the expression.
A. 2i
B. -i
C. ±2
D. -2i
Answer: A
Mathematics
You might also like to view...
Provide an appropriate response. Shortly before a mayoral election, a market research firm took a poll to find out which candidate people were planning to vote for. The results are shown below. 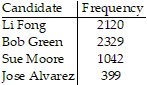 You wish to construct a graph to represent the data. It should be easy to see from your graph which candidate is in the lead. Which graph would be more useful, a bar graph or a pie chart? Explain your thinking.
What will be an ideal response?
Mathematics
Evaluate the expression for the given values of the variables, if possible.-11x x = -17
A. -187 B. -198 C. 198 D. 187
Mathematics
Use the vertical line test to determine if the graph is a function.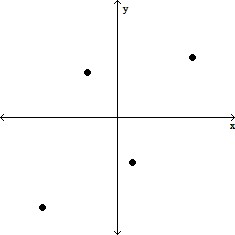
A. Yes B. No
Mathematics
Find the slope of the line. 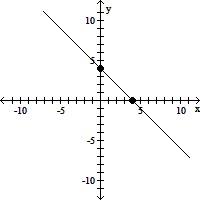
A. -4 B. -1 C. 1 D. 4
Mathematics