The table above gives the production possibilities frontier for two countries, Anaconda and Bear. This table shows that
A) when Anaconda and Bear specialize and trade, Anaconda should specialize in the production of shoes.
B) when Anaconda and Bear specialize and trade, Anaconda should produce at its production point E.
C) Anaconda has an absolute advantage in the production of corn and shoes.
D) Bear can consume no more than 2 bushels of corn and 700 pairs of shoes.
E) Bear is unable to gain from trade with Anaconda.
B
You might also like to view...
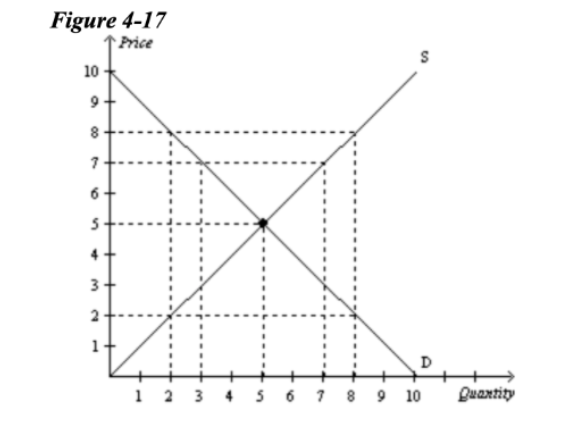
Refer to figure 4-17. At a price of
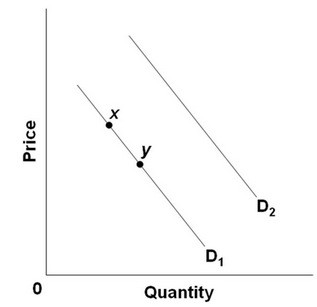 Refer to the above diagram. A decrease in demand is depicted by a:
A. shift from D2 to D1. B. move from point y to point x. C. move from point x to point y. D. shift from D1 to D2.
Alyssa runs a "Dessert of the month" delivery service. To operate her business each year, she spends $30,000 on baking supplies (flour, sugar, etc.), $50,000 on rent for her shop, and $5,000 for utilities. She owns her delivery van, estimating that in alternate uses it could generate $15,000 in income per year. Alyssa has other funds tied up in the business that could earn her $2,000 per year in interest. Alyssa has been offered $50,000 to work full time at a competing bakery. Her bakery generates $160,000 per year in revenue from subscriptions to her monthly service.Based on the information above, which of the following is true about Alyssa's costs and profits?
A. Alyssa's implicit costs are $67,000 and her economic profits are $93,000. B. Alyssa's explicit costs are $85,000 and her accounting profits are $8,000. C. Alyssa's explicit costs are $67,000 and her implicit costs are $85,000. D. Alyssa's accounting profits are $75,000 and her economic profits are $8,000.
Per-capita output growth is the growth rate of output
A. of the entire economy. B. per worker in the economy. C. for capitalist economies. D. per person in the economy.