According to the following graphs, what is X1?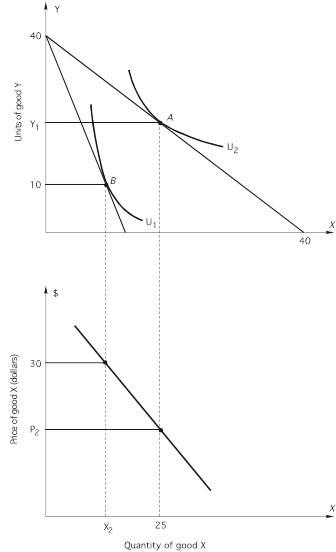 The price of Y is $15 per unit.
A. 20
B. 12
C. 10
D. 18
E. none of the above
Answer: E
You might also like to view...
Evidence presented in the text suggests that birthrates among developing countries are lower with
(a) higher growth. (b) higher inequality. (c) higher GNP per capita. (d) all of the above.
A decrease in the price of milk will
a. increase the demand for milk. b. reduce the demand for milk. c. reduce the demand for orange juice, a substitute for milk. d. do both a and c
Other things the same, people in the U.S. would want to save more if the real interest rate in the U.S
a. fell. The increased saving would increase the quantity of loanable funds demanded. b. fell. The increased saving would increase the quantity of loanable funds supplied. c. rose. The increased saving would increase the quantity of loanable funds demanded. d. rose. The increased saving would increase the quantity of loanable funds supplied.
GDP underestimates our economic well-being:
A. because it includes the value of work done by illegal immigrants. B. because it includes the value of work done by nannies. C. because it ignores leisure. D. because it includes the value of work done by householders.