This graph represents the cost and revenue curves of a firm in a perfectly competitive market.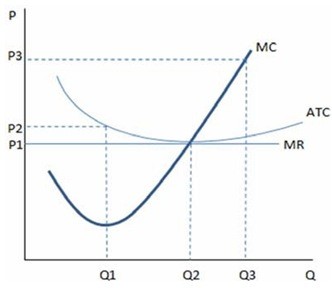 According to the graph shown, if a firm is producing at Q2, and it is identical to others in the market:
A. firms will enter this market.
B. economic profits are zero.
C. firms will leave this market.
D. profits are not being maximized.
Answer: B
You might also like to view...
A firm has explicit costs of $110,000 and total revenue of $120,000. Which of the following is true about the firm?
A) The firm might be making an economic profit but we need more information about implicit costs to know for sure. B) The firm is definitely making an economic profit because it must be minimizing its opportunity cost. C) The firm is incurring an economic loss if implicit costs are $10,000. D) The firm is making a normal profit if implicit costs are $0. E) The firm may be making an economic profit but only if implicit costs are negative.
The figure above shows the market for umbrellas in Sunville. When the market for umbrellas in Sunville is in equilibrium, what is the total deadweight loss?
A) $2,000 B) $800 C) $0 D) 600 umbrellas
Refer to Figure 5-7. The marginal benefit of reducing pollution curve is the same curve as
A) the supply of pollution reduction curve. B) the demand for pollution reduction curve. C) the external benefit curve. D) the positive externality curve.
Labor productivity refers to the total amount of output a worker produces in some period of time (an hour, a week, a month, a year)
a. True b. False Indicate whether the statement is true or false