Graphically, the average productivity of labor would be illustrated by the slope of the marginal productivity curve at the relevant point
a. the slope of the total product curve at the relevant point.
b.
c. the negative of the slope of the marginal productivity curve at the relevant point.
d. the slope of the chord connecting the origin with the relevant point on the total output curve.
d
You might also like to view...
Between 1960 and 1997, the federal budget was never in surplus
a. True b. False Indicate whether the statement is true or false
You are shown a graph of a monopolist in long-run equilibrium and a graph of a monopolistically competitive firm in short-run equilibrium. How could you tell which is which?
A. In the graph of monopolistic competition, the MR curve could be closer to the demand curve. B. In the graph of monopoly, the MR curve would be closer to the demand curve. C. You probably could not. D. In the graph of monopoly, the MC would slope upward.
Which statement is true?
a. The prime interest rate will be higher than the Federal funds rate b. The Federal funds rate and the prime interest rate will be the same c. The Federal funds rate will be higher than the prime interest rate d. The prime interest rate will be the same as the discount rate
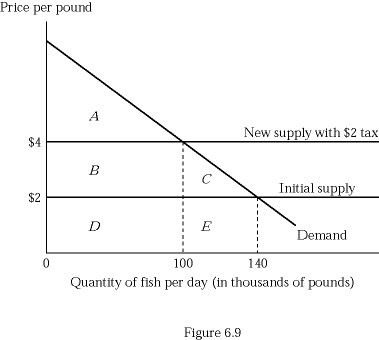 Figure 6.9 depicts a hypothetical fish market with a horizontal supply curve. Suppose the government imposes a tax of $2 per pound of fish, and the tax is paid in legal terms by producers. Which of the following shows the loss of consumer surplus on the fish that are not consumed because of the tax?
A. Triangle C B. Rectangle B + Triangle C C. Triangle C + Rectangle E D. Rectangle B + Rectangle D