In the previous problem, the solution of the eigenvalue problem is
Select the correct answer.
?
?
A. 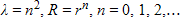
B. 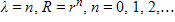
C. 
D. 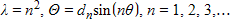
E. 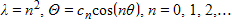
Answer: D
You might also like to view...
Solve the problem.Form a frequency distribution table for the data below. Do not group the data.12, 13, 18, 19, 2412, 13, 19, 24, 13
A. 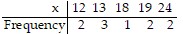
B. 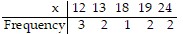
C. 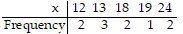
D. 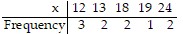
Simplify completely. If the fraction is improper, write it as a mixed number.
A. 1
B. 2
C. 3
D. 
Solve the problem.Suppose that during a certain step in a chemical manufacturing process the amount of hydrogen chloride dissolved in a solution, measured in parts per million (ppm), is related to the elapsed time measured from the beginning of the step. Use the following table as a representation of this relationship. Make a scatterplot of the data. What is happening to the amount of hydrogen chloride in solution during this time frame?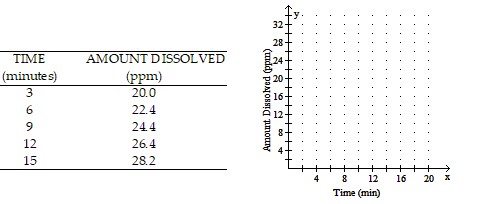
A. The amount of hydrogen chloride dissolved
decreased as time elapsed.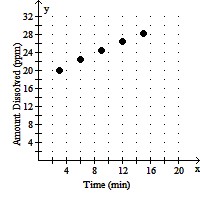
B. The amount of hydrogen chloride dissolved
increased as time elapsed.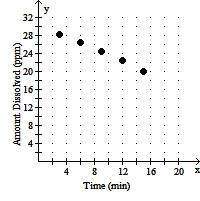
C. The amount of hydrogen chloride dissolved
increased as time elapsed.
D. The amount of hydrogen chloride dissolved
increased as time elapsed.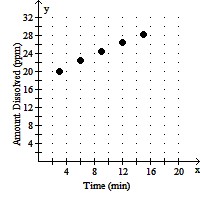
Solve the equation in part (a) graphically, expressing the solution to the nearest hundredth. Then, use the graph to solve the associated inequalities in parts (b) and (c), expressing endpoints to the nearest hundredth.(a)  = 0; (b)
 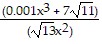 > 0; (c)
  < 0
< 0
A. (a) {-28.53} (b) (-28.53, ?) (c) (-?, -28.53) B. (a) ? (b) (-?, ?) (c) ? C. (a) {-7.47} (b) (-7.47, ?) (c) (-?, -7.47) D. (a) {-28.53} (b) (-28.53, 0) ? (0, ?) (c) (-?, -28.53)