The graph below shows the percentage of students enrolled in the College of Engineering at State University. Use the graph to answer the question.  Between what two years is the difference in function values equal to 5%?
A. between 1995 and 2000
B. between 1990 and 1995
C. between 1980 and 1985
D. between 1970 and 1975
Answer: B
You might also like to view...
Solve the triangle.a = 10, b = 10, c = 8
A. A = 67.4°, B = 67.4°, C = 45.2° B. A = 66.4°, B = 66.4°, C = 47.2° C. A = 66.4°, B = 47.2°, C = 66.4° D. A = 47.2°, B = 66.4°, C = 66.4°
Answer the question.How can the graph of f(x) = (x - 1)2 - 7 be obtained from the graph of y = x2?
A. Shift it 1 units horizontally to the right and shift it 7 units downward. B. Shift it 7 units horizontally to the right and shift it 1 units downward. C. Shift it 1 units horizontally to the left and shift it 7 units upward. D. Shift it 1 units horizontally to the left and shift it 7 units downward.
Identify the place value of the specified digit.9 in the number 309,675,064
A. billions B. hundred millions C. millions D. ten millions
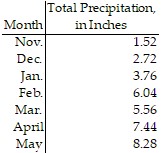
Construct a broken-line graph of the data in the table.The following table gives the total amount of precipitation during the given months. Use time on the horizontal scale for your line graph.
What will be an ideal response?