Refer to the double-bar graph below which shows the number of male and female athletes at a university over a four-year period. Solve the problem.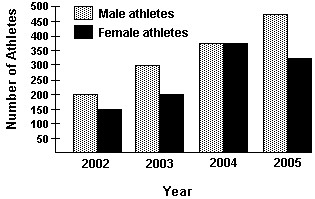 What was the percent of increase in the number of male athletes from 2002 to 2003?
A. 75%
B. 50%
C. 25%
D. 100%
Answer: B
You might also like to view...
Use the given information to find the exact value of the trigonometric function.cos ? = -  , sin ? > 0
 Find cos
  .
.
A. 
B. 
C. - 
D. - 
Use the Distributive Property to remove the parentheses.7(2x + 2 + y)
A. 14x + 14 + y B. 14x + 2 + 7y C. 14x + 14 + 7y D. 14x + 2 + y
Present data in the form of tables. For the data set shown by the table, a. Create a scatter plot for the data. b. Use the scatter plot to determine whether an exponential function or a logarithmic function is the best choice for modeling the data.Percentage of Population Living in the South Suburbs of a Large City 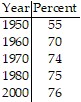

What will be an ideal response?
Fill in the blank with one of the symbols =, <, or > to produce a true statement.-  ?-11
?-11
A. < B. = C. >