Exhibit 14A-1 Aggregate demand and supply model

Beginning in Exhibit 14A-1 from long-run equilibrium at point E1, the aggregate demand curve shifts to AD2 . The economy's path to a new long-run equilibrium is represented by a movement from:
A. E3 to E1 to E2.
B. E1 to E3 to E2.
C. E2 to E1 to E2.
D. E1 to E2 to E3.
Answer: D
You might also like to view...
Factor(s) explaining China's rapid growth
a. foreign trade zones b. high domestic savings c. Greater China d. China's export orientation e. All of the above
Figure 7-5
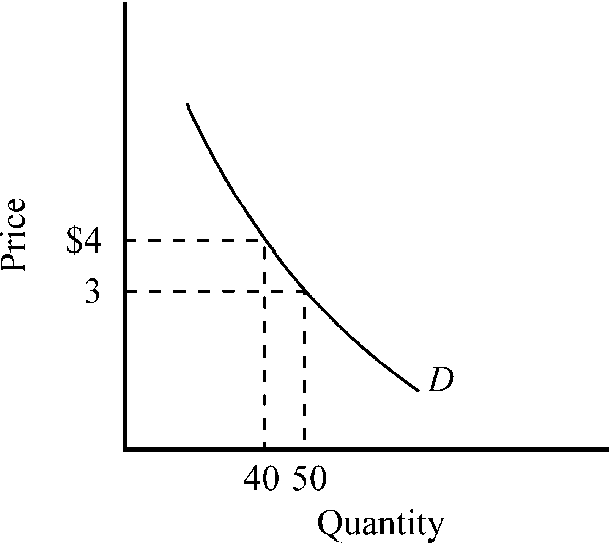
Which of the following is true for the demand curve depicted in ?
a.
In the $3 to $4 range, the price elasticity of the demand curve equals 1.
b.
At a price of $3, the price elasticity of the demand curve equals approximately -3.3.
c.
In the $3 to $4 range, the demand curve is inelastic.
d.
In the $3 to $4 range, the demand curve is elastic.
Refer to the table below. At the $3 price for labor the most efficient technique will result in an:
The following table illustrates alternative production techniques for producing 18 widgets that can be sold for $1 each for a total revenue of $18.
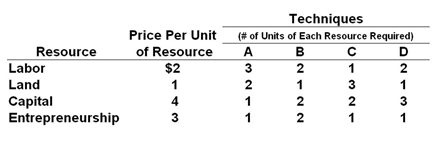
A. Economic loss of $2
B. Economic profit of $l
C. Economic profit of $2
D. Economic profit of $3
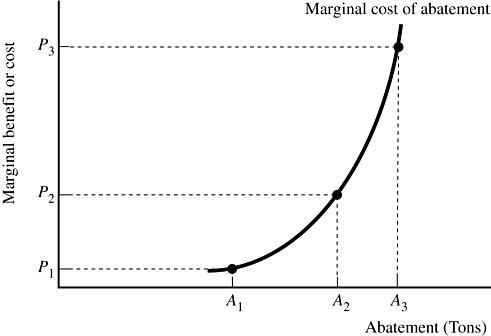
 A firm that generates pollution is illustrated in Figure 9.7. Suppose the government is considering changing the pollution tax from P3 to P2. That new policy would:
A. increase the marginal benefit to firms of abating, and thus encourage greater abatement. B. increase the marginal benefit to firms of abating, causing them to generate more pollution. C. reduce the marginal benefit to firms of abating, causing them to generate more pollution. D. reduce the marginal benefit to firms of abating, and thus encourage greater abatement.