Refer to the graphs shown. Suppose the price of a good that is a substitute in both consumption and production for the good depicted in the graph falls. The expected shifts in supply and demand are shown in: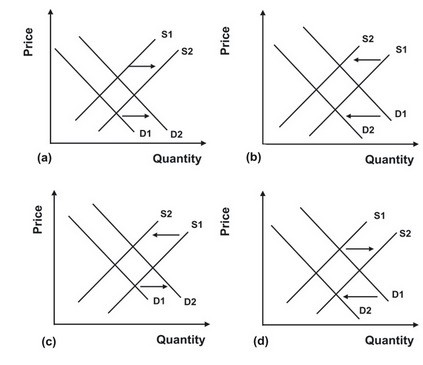
A. a.
B. b.
C. c.
D. d.
Answer: D
You might also like to view...
The figure above shows the market for milk. If the efficient quantity of milk is produced, the consumer surplus is
A) $100. B) $400. C) $200. D) $600.
On the graph above, consider a point A on the aggregate supply curve and above the aggregate demand curve. At this point, ________
A) quantity demanded equals output, but the inflation rate will fall, so output will rise B) quantity demanded is greater than quantity supplied, so the inflation rate will rise C) output is greater than the quantity demanded, so output will fall D) the aggregate demand curve will shift to the right until quantity demanded is equal to quantity supplied E) none of the above
Suppose in the automobile industry with free entry and exit, the marginal cost is constant at $5,000, two identical manufacturers are currently producing 1,000 cars each and earning zero economic profit
If the equilibrium price is $20,000, then what is the fixed cost for each manufacturer? A) $20,000,000 B) $15,000,000 C) $5,000,000 D) $10,000,000
The total product curve graphically shows the:
A. Minimum level of output that can be produced by a quantity of a variable resource holding constant the quantity of other resources B. Minimum level of output that can be produced by a quantity of a fixed resource letting other resources vary C. Maximum level of output that can be produced by a quantity of a fixed resource letting other resources vary D. Maximum level of output that can be produced by a quantity of a variable resource holding constant the quantity of other resources