In Figure 11.1, a decrease in the marginal propensity to save is represented by a change in the consumption function from
A) C1 to C3. B) C3 to C1. C) C2 to C1. D) C1 to C2.
D
You might also like to view...
If an increase in the monetary base of $8 billion increases the quantity of money by $64 billion, then the money multiplier is equal to ________
A) $64 billion B) 8 C) $8 billion D) 1/8
A constant-cost industry will have
A) a perfectly elastic long-run supply curve. B) a perfectly inelastic long-run supply curve. C) an upward sloping demand curve in the long run. D) an upward sloping supply curve in the long run.
Arnie Ziffel has $20 per week to spend on any combination of pineapples and green tea. The price of a pineapple is $4 and the price of a bottle of green tea is $2. The table below shows Arnie's utility values. Use the table to answer the questions that
follow the table. Quantity of Pineapples Total Utility Marginal Utility Marginal Utility per Dollar Quantity of Green Tea Total Utility Marginal Utility Marginal Utility per Dollar 1 32 1 28 2 52 2 46 3 64 3 54 4 68 4 60 5 70 5 64 6 71 6 66 7 71 7 67 a. Complete the table by filling in the blank spaces. b. Suppose Arnold purchases 4 pineapples and 2 bottles of green tea. Is he consuming the optimal consumption bundle? If so, explain why. If not, what combination should he buy and why? What will be an ideal response?
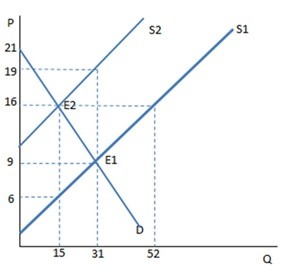 Suppose a tax on sellers has been imposed as shown in the graph. Once the tax is in place, the buyers experience:
A. a decrease in demand. B. an increase in quantity demanded. C. a decrease in quantity demanded. D. an increase in demand.