Refer to Figure 21-3. Which of the following is consistent with the graph depicted above?
A) Taxes are changed so that real interest income is taxed rather than nominal interest income.
B) Technological change increases the profitability of new investment.
C) The government runs a budget deficit.
D) An expected recession decreases the profitability of new investment.
Figure 21-4
A
You might also like to view...
For a person to have a comparative advantage in producing a product, he must be able to produce that product at a higher opportunity cost than his competitors
Indicate whether the statement is true or false
In 1994, the state of California suffered a devastating earthquake. To help pay for the damages, the state raised its sales tax by one cent per dollar of expenditure on most consumer goods
This state sales tax is an example of what economists call: A) an ad valorem tax. B) a specific tax. C) a neutral tax. D) a negative tax. E) none of the above
List some reasons why the aggregate demand curve of an economy may shift to the left
Refer to the diagrams. The solid lines are production possibilities curves; the dashed lines are trading possibilities curves. The data contained in the production possibilities curves are based on the assumption of:
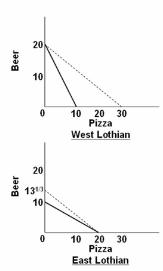
A. imperfect substitutability of resources between beer and pizza production.
B. constant costs.
C. decreasing costs.
D. increasing costs.