The table below shows four different currencies and how much of each currency can be purchased with a U.S. dollar.
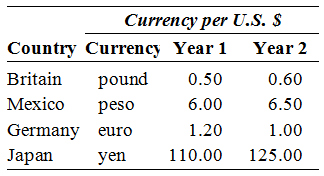
Among which nations has the U.S. dollar appreciated (A) or depreciated (D) from year 1 to year 2? Explain the appreciation or depreciation using the nations and numbers in the table.
The U.S. dollar has depreciated against the British pound because in year 1 a U.S. dollar would buy 0.5 (one half) of a British pound, but in year 2 it bought .60 of a British pound. The U.S. dollar also appreciated against the euro because in year 1 you got 1.2 euros for a dollar, but in year 2 you get 1.0 euros for a dollar.
The U.S. dollar appreciated against the Mexican peso and Japanese yen. A U.S. dollar bought 6.0 pesos in year 1 but 6.5 pesos in year 2. Also, a U.S. dollar purchased 110 Japanese yen in year 1, but 125 Japanese yen in year 2.
You might also like to view...
The figure above shows the market for milk. If 100 gallons of milk a day are available, the ________ price that consumers are willing to pay for the last gallon is ________
A) maximum; $2.50 B) minimum; $3.00 C) maximum; $4.00 D) minimum; $4.00
The yield on a thirty-year Treasury bond is 8% at the same time as the yield on two-year Treasury note is 5%. This occurrence
A) indicates that the yield curve is downward sloping. B) is well explained by the segmented markets theory. C) is largely explained by the favorable tax treatment of Treasury notes. D) indicates that the bond market is anticipating that inflation will fall.
Suppose the demand for pork is given by the equation
Q = p-0.5pc0.2 where pc is the price of chicken. Compute the cross-price elasticity of demand for pork
Refer to the diagram above, which shows three supply curves for corn. A movement from point a to point b is caused by a change in the:
a. Price of corn in the market b. Number of corn farmers c. Price of resources used to produce corn d. Technology of corn farming