Graph I below shows E.T.'s equilibrium choices of beer and candy for three different prices of beer. (I1, I2, and I3 are indifference curves. The price of a package of candy is constant at $1.00.) Letting PC represent the price of beer, which demand curve (d) above is consistent with graph I?
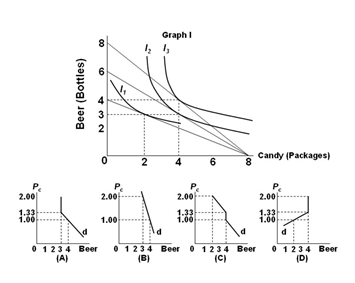
A. Graph A
B. Graph B
C. Graph C
D. Graph D
A. Graph A
You might also like to view...
Randomization is the assignment of subjects by ________ to a ________
A) chance, rather than by choice; treatment group or into a test group. B) choice, rather than by chance; treatment group or into a test group. C) choice, rather than by chance; treatment group or into a control group. D) chance, rather than by choice; treatment group or into a control group.
Profits will be maximized when the slope of the total revenue curve and the slope of the total cost curve equal zero.
Answer the following statement true (T) or false (F)
A business produces 5,00 . units per month. Costs include: $12,00 . on raw materials, $20,00 . on operators and $14,00 . on sales people. Other costs of running the factory were $50,00 . for rent and $30,00 . on other fixed overheads. In order to break even the selling price per unit will have to be:
a. $25.20 b. $29.60 c. $20.30 d. $28
Exports as a percentage of global GDPs have declined since 1980
Indicate whether the statement is true or false