In Figure 13-1, which panel shows the effect of inflation on the interest rate?
a. Panel (C)
b. Panel (D)
c. Panel (A)
d. Panel (B)
Answer: c. Panel (A)
You might also like to view...
Refer to Figure f. A benefit function is plotted in Figure f. The distance C represents the:
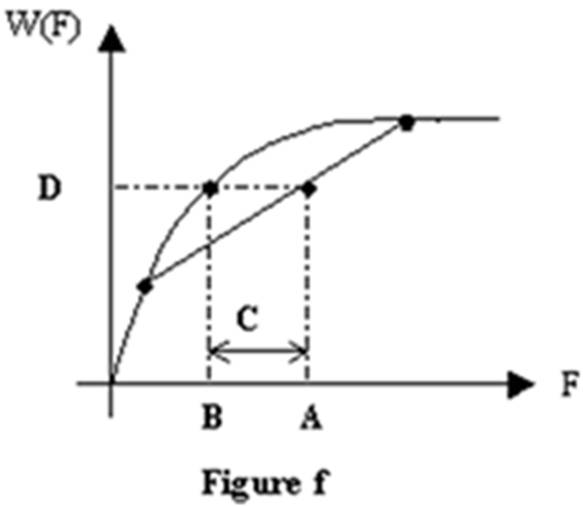
A. risk premium of the consumption bundle.
B. expected utility of the consumption bundle.
C. certainty equivalent of the consumption bundle.
D. expected consumption.
The price of an airline ticket from Denver to Chicago costs $450. A bus ticket costs $150. Traveling by plane takes 2 hours compared with 32 hours by bus. Other things constant, Erica would gain by choosing air travel if, and only if, she values her time at more than
A) $5 per hour. B) $300 per hour. C) $10 per hour. D) $9.38 per hour.
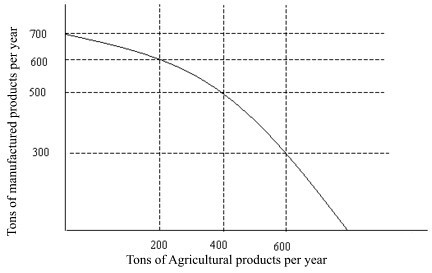
 The production possibilities curve in Figure 2.1 illustrates the notion of:
A. increased factory goods production. B. increased agricultural production. C. diminishing resources. D. opportunity cost.
In June, buyers of titanium expect that the price of titanium will fall in July. What happens in the titanium market in June, holding everything else constant?
A) The demand curve shifts to the right. B) The quantity demanded increases. C) The quantity demanded decreases. D) The demand curve shifts to the left.