In the figure above, the quantity of sugar beets produced is ________ million tons per year, and the quantity bought by consumers is ________ million tons per year
A) 30; 20
B) 20; 30
C) 25; 20
D) 20; 25
E) 25; 25
A
You might also like to view...
Short run average expenditure curves are tangent at their lowest point to the long run average cost curve.
Answer the following statement true (T) or false (F)
In the analysis of the interest rate effect, when the price level changes, the quantity of money households and firms' want to hold and interest rates move in the ____ direction as the change in the price level, while investment and the quantity RGDP demanded move in the ____ direction as the change in the price level
a. Same, same b. Same, opposite c. Opposite, same d. opposite, opposite
Refer to the graph shown. If a firm expected to produce 900 units when it built its plant but now desires to reduce its output to 600 units in the short run, it will use the plant size represented by: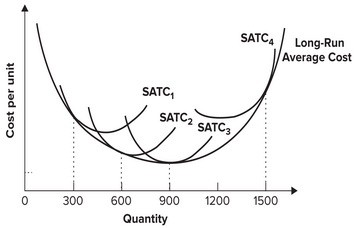
A. SATC1. B. SATC2. C. SATC3. D. SATC4.
Comparing a perfectly competitive market to a monopoly, which of the following is true?
A. Price will be higher and quantity will be lower in the perfectly competitive market than in the monopoly. B. Price will be higher than marginal cost in the perfectly competitive market but will be equal to marginal cost in the monopoly. C. Price will be equal to marginal revenue in the perfectly competitive market but will be higher than marginal revenue in the monopoly. D. at that point on the market demand curve which intersects the marginal cost curve, the monopolist and the perfectly competitive firm will maximize profits.