Consider a study on the number of accidents that occurred in ten U.S. states in different cities for three consecutive years.
Create a PivotTable in Excel to answer the following questions. The PivotTable should group the number of accidents
into yearly bins and display the sum of accidents that occurred each year in columns of Excel. Row labels should include
the accident locations and allow for grouping the locations into states or viewing by city. You should also sort the
PivotTable so that the states with the greatest number of accidents between 2011 and 2013 appear at the top of the PivotTable.
StateCityNumber of accidents
Year
GARock Spring52
2011
GADoraville44
2011
GAEllaville67
2011
FLJacksonville53
2011
GAStockbridge72
2011
FLBelleview63
2012
AZPhoenix69
2011
FLCrestview51
2012
IAJohnston48
2012
GARockmart44
2012
COGreenwood Village53
2011
GAJonesboro54
2011
GADecatur76
2013
FLClearwater76
2013
GAGray57
2012
CANevada City76
2013
FLMilton61
2011
GAWoodstock78
2013
GACumming70
2012
GAStatesboro47
2013
FLPalm Beach42
2011
COGreeley60
2012
FLSarasota40
2011
FLApollo Beach75
2011
AZPrescott40
2012
FLPort St. Lucie61
2012
GAStockbridge78
2012
GAAtlanta60
2011
COWindsor43
2013
COCastle Rock55
2011
GAClayton58
2011
FLTampa58
2011
GAJackson63
2012
GAFranklin64
2012
GAMacon71
2011
FLCocoa Beach76
2011
GAValdosta76
2011
GADallas64
2012
FLBrooksville41
2013
FLWinter Park41
2011
ALBirmingham74
2013
ALBirmingham78
2011
GAEast Ellijay80
2013
GACartersville66
2011
CASan Luis Obispo57
2011
CANapa65
2012
GASpringfield80
2013
GAClarkesville60
2012
CAPalm Springs69
2011
FLPort Orange77
2013
GAWatkinsville48
2012
GARoswell65
2013
COLouisville62
2012
CODenver80
2013
GAMcDonough54
2012
GABrunswick48
2013
AZScottsdale75
2011
FLOrlando41
2013
ARBatesville60
2011
GAAtlanta49
2012
GAMcCaysville54
2011
GADawsonville62
2013
FLCoral Gables53
2011
FLCarrabelle49
2012
AZScottsdale42
2012
GAVidalia66
2013
GATifton73
2011
CAWestminster68
2011
CAWoodland Hills72
2013
AZScottsdale79
2013
GABarnesville54
2011
GAGordon47
2013
FLTampa62
2012
FLJacksonville68
2013
FLCrawfordville56
2013
FLPonte Vedra Beach50
2013
GAWinder61
2012
GADouglasville51
2011
GAEllijay40
2011
FLBradenton43
2011
CASonoma67
2012
CASolvang65
2013
CAChico61
2013
CAStockton61
2011
FLOcala56
2011
FLBartow61
2011
FLPanama City Beach45
2012
FLPort Saint Joe68
2011
GAAcworth42
2013
GAJasper48
2011
FLLantana72
2012
FLClewiston61
2011
FLAventura57
2012
FLMiami67
2012
GASavannah46
2012
FLEnglewood63
2012
CAGranite Bay64
2012
FLTampa60
2013
FLNaples58
2011
FLFort Lauderdale57
2012
GASaint Marys62
2013
CASan Diego61
2012
AZMesa70
2012
FLBonifay47
2011
CASan Rafael77
2013
CAOakland57
2013
FLFort Pierce48
2011
FLClermont49
2013
FLPalatka70
2011
AZPhoenix52
2013
GACartersville41
2012
FLKey West54
2013
GACarrollton65
2012
ALFort Deposit68
2013
GAHiawassee58
2013
GAEllijay61
2012
GADuluth47
2012
FLOrlando78
2011
FLBoca Raton45
2012
CALa Jolla45
2011
FLMarco Island78
2012
CALos Angeles61
2011
GACornelia75
2011
FLImmokalee55
2011
GACarrollton56
2013
FLMiami51
2011
CASanta Monica54
2011
CALa Jolla40
2013
ALIrondale80
2012
FLPanama City76
2012
GAAtlanta64
2013
AZMesa41
2011
FLMiami75
2013
GAReidsville77
2011
GANorcross52
2013
GAAlpharetta54
2011
GAAlpharetta58
2012
FLBoca Raton78
2011
CANewport Beach55
2012
CAPasadena59
2012
ARBentonville67
2012
GAAlpharetta50
2013
CASan Francisco41
2013
CALos Angeles80
2012
CASan Diego57
2013
AZPhoenix67
2012
FLBradenton77
2012
FLNaples59
2013
GALawrenceville58
2012
FLOcala51
2013
CABakersfield68
2011
COPueblo47
2011
AZFlagstaff42
2013
IASioux City53
2013
CAVentura46
2012
ALBirmingham58
2012
GANewnan45
2013
AZGilbert40
2011
ALMontgomery64
2011
FLVenice71
2013
FLSarasota61
2013
FLJupiter66
2012
GAGray69
2012
GAPerry72
2012
GAMacon40
2012
GAWoodstock78
2012
GASuwanee58
2011
CATemecula45
2012
CARancho Cucamonga57
2013
GAWinder77
2013
CALos Angeles66
2013
CAIrvine74
2013
GANewnan63
2011
GAVilla Rica67
2012
GAFayetteville55
2013
FLCoral Gables75
2013
CACalabasas42
2012
GAKennesaw63
2012
COGreeley52
2013
COColorado Springs79
2013
GAStockbridge47
2013
GACommerce65
2012
FLCape Coral69
2013
CAMerced52
2011
CACulver City55
2011
GAMcDonough63
2013
CARedlands48
2012
GADuluth51
2013
GAJackson68
2013
CAPomona41
2011
CANewport Beach61
2011
GALoganville68
2012
FLBradenton44
2013
FLTallahassee60
2012
CATorrance42
2013
CTStamford70
2011
ARGravette44
2013
HIHonolulu70
2011
a. Which state had the greatest number of accidents between 2011 and 2013?b. How many accidents occurred in the state of Colorado (CO) in 2012? In what cities did these accidents occur?c. Use the PivotTable's filter capability to view only the accidents in Alabama (AL), Arizona (AZ), and Arkansas (AR) for the years 2011 through 2013. What is the total number of accidents in these states between 2011 and 2013?d. Create a PivotChart to display a column chart that shows the total number of accidents in each year 2011 through 2013 in the state of California. Adjust the formatting of this column chart so that it best conveys the data. What does this column chart suggest about accidents between 2011 and 2013 in California? Discuss.
Hint: You may have to switch the row and column labels in the PivotChart to get the best presentation for your PivotChart.
What will be an ideal response?
a.
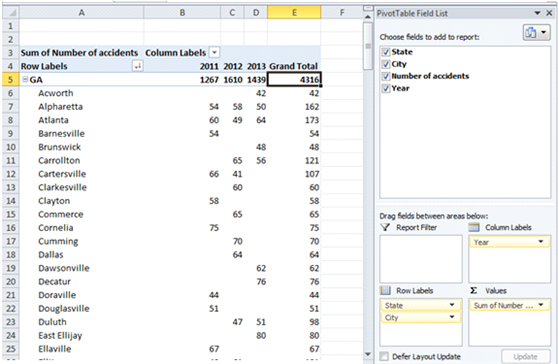
Georgia (GA) had the greatest number of accidents between 2011 and 2013.
b.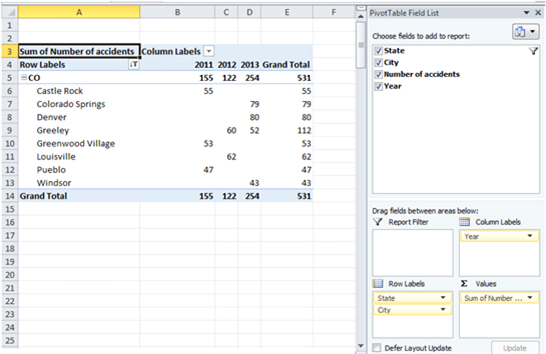
The state of Colorado had 122 accidents in the year 2012 in the cities, Greeley and
Louisville.
c.
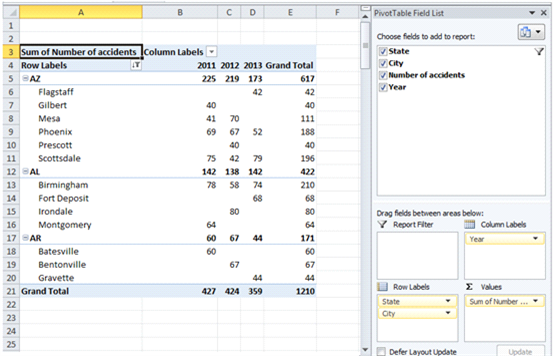
There were 1210 accidents between the years 2011 and 2013 in Alabama (AL),
Arizona (AZ), and Arkansas (AR).
d.
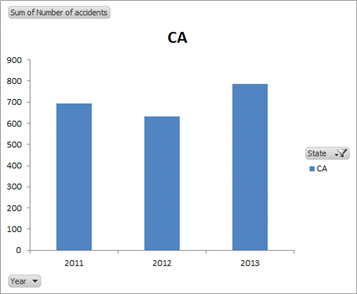
The accidents have increased in the year 2013 compared to the past two years.
You might also like to view...
Executional frameworks are a component of a MECCAS model
Indicate whether the statement is true or false
The product moment correlation is also known as the Pearson correlation coefficient and as ________
A) simple correlation B) bivariate correlation C) correlation coefficient D) all of the above
The cash balance on April 1 is $12,000. Assume that there will be no financing transactions or costs during the quarter. Calculate the projected cash balance at the end of June.
Lyon Corp. has provided a part of its budget for the second quarter:
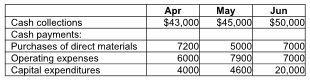
A) $115,300
B) $37,800
C) $81,300
D) $65,300
Courts of appeals in the various states decide many cases that never become stare decisis
a. True b. False