This graph shows the marginal cost and marginal benefit associated with roadside litter clean up. Assume that the marginal benefit curve and marginal cost curve each have their usual slope.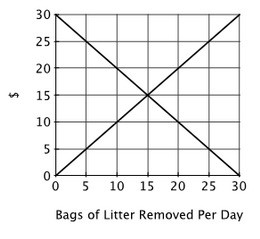 Suppose the state highway department has picked up 15 bags of litter. Protesters have staged a demonstration demanding that the highway department return to pick up the remaining litter. From an economic efficiency perspective, the protesters have a ________ claim because ________.
A. legitimate; litter generates a negative externality
B. faulty; the government is not responsible for taking care of private property
C. faulty; the additional resources needed to remove more litter could be better used elsewhere
D. legitimate; the government has a responsibility to take action when private market incentives do not yield the socially optimal outcome
Answer: C
You might also like to view...
When there is an increase in demand,
A. the demand curve shifts to the right of the original demand curve. B. the demand curve rotates clockwise. C. the demand curve shifts to the left of the original demand curve. D. the demand curve rotates counterclockwise. E. a lower price has increased the amount of the good that consumers will buy.
Job search is defined as
A) equivalent to job rationing. B) being paid an efficiency wage. C) the activity of looking for an acceptable, vacant job. D) attending school to increase your employability. E) saying you are looking for a job when you are actually not looking.
Tax incidence is:
A. the difference between what the buyers pay and what the sellers receive in a market where taxes are present. B. the relative tax burden borne by buyers and sellers. C. the generated revenue that comes from taxes in markets. D. the difference between the tax revenue generated and the value of deadweight loss caused by the imposition of the tax.
Refer to the information provided in Figure 3.11 below to answer the following question(s).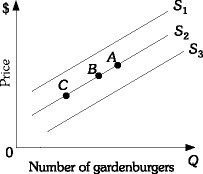 Figure 3.11Refer to Figure 3.11. A decrease in supply is represented by the movement from
A. Point B to Point C along supply curve S2. B. Point B to Point A along supply curve S2. C. S2 to S1. D. S2 to S3.