Use the horizontal line test to determine whether the function is one-to-one.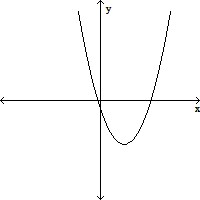
A. Yes
B. No
Answer: B
You might also like to view...
Assume that a sample of bivariate data yields the correlation coefficient, r, indicated. Use the critical values table for the specified sample size and level of significance to determine whether a linear correlation exists.r = 0.305 when n = 5 at ? = 0.05
A. No B. Yes
The figure below is a square ABCD with center O. (M, N, P, and Q are the midpoints of the sides.)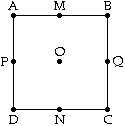 Which of the following rotations is a symmetry of the square?
A. a 60° clockwise rotation with center O B. a 90° clockwise rotation with center A C. a 90° clockwise rotation with center O D. a 90° clockwise rotation with center P E. none of these
Multiply.3(1087)
A. 3161 B. 3361 C. 3271 D. 3261
Use the pictograph to answer the question.This pictograph shows projected sales of compact disks (CDs) for a popular rock band for seven consecutive years. 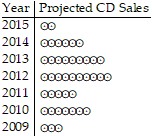 ? = 10,000 CDsBetween which two consecutive years is the greatest decline in sales indicated?
A. Between 2010 and 2011 B. Between 2011 and 2012 C. Between 2014 and 2015 D. Between 2013 and 2014