Graph the function.f(x) = 3-x
A. 
B. 
C. 
D. 
Answer: A
You might also like to view...
Find the center of mass of a thin plate covering the given region with the given density function.The triangular region cut from the first quadrant by the line y = -x + 7, with density ?(x) = x
A.  =
=  ,
,  =
= 
B.  =
=  ,
,  =
= 
C.  =
=  ,
,  =
= 
D.  =
=  ,
,  =
= 
Use a factor pair table to find all of the factor pairs of each number.30
A. 5 and 6; 10 and 30 B. 1 and 30; 2 and 20; 3 and 10; 5 and 6 C. 1 and 5; 6 and 30 D. 1 and 30; 2 and 15; 3 and 10; 5 and 6
Construct a boxplot for the given data. Include values of the 5-number summary in all boxplots.The ages of the 35 members of a track and field team are listed below. Construct a boxplot for the data set.15 16 18 18 18 19 2020 20 21 21 22 22 2323 24 24 24 25 25 2627 27 28 29 29 30 3131 33 34 35 39 42 48
A. 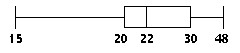
B. 
C. 
D. 
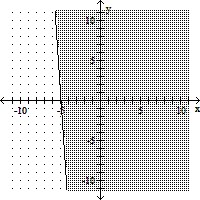
Graph the inequality.-3x - 5y ? 15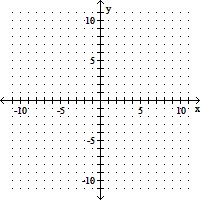
A. 
B. 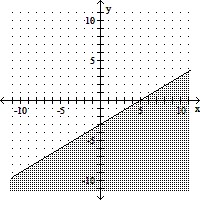
C. 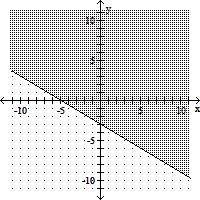
D.