Refer to the information provided in Figure 16.6 below to answer the question(s) that follow. 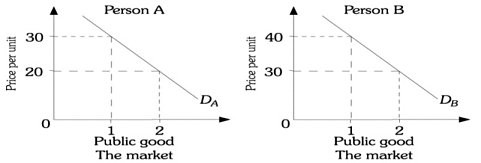
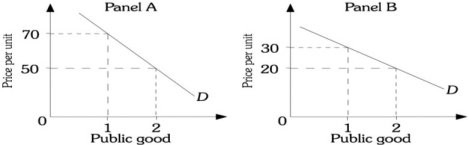
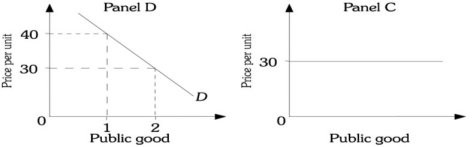 Figure 16.6Refer to Figure 16.6. In the top portion of the figure are the demand curves of two people in this society for a public good. Which of the panels represents the market demand curve for the public good?
A. Panel A
B. Panel B
C. Panel C
D. Panel D
Answer: A
You might also like to view...
Use the following table for a certain product's market in Marketopia to answer the next question.Quantity Demanded DomesticallyPriceQuantity Supplied Domestically1,400$102,2001,60092,0001,80081,8002,00071,6002,20061,4002,40051,200If the world price of the product is $6 and a tariff of $1 per unit imported is imposed, then the quantity of output that would be supplied domestically would be ________ units and the quantity of output that would be imported would be ________ units.
A. 1,600; 400 B. 1,400; 800 C. 1,400; 400 D. 1,600; 800
In 2007 the total amount of tax collection the federal government brought to the Treasury from all sources was $2.7 Trillion. The population of the U.S. is about 300 million
Assume that all forms of government taxation were abolished and each citizen was required to pay exactly the same as everyone else. What would be the tax burden in dollar terms on each citizen (man, women and child)? How would you characterize a tax system like this? Who would likely protest the most? Who would benefit the most? If the new tax was not repealed, what changes do you believe would take place in the government's budget?
Refer to Figure 13-2. The marginal revenue from selling the additional unit Qb instead of Qa equals
A) the area (H - E). B) the area (G + H). C) the area G. D) the area (E + F) - (G + H).
The kinked demand curve depicts
A. cut-throat competition. B. cartels. C. collusive oligopoly. D. price leadership.