Refer to the figure above. After the demand curve shifts to D2, if the price is held below the new equilibrium, then:
A) the quantity demanded will equal the quantity supplied.
B) the quantity demanded will be greater than the quantity supplied.
C) the quantity demanded will be less than the quantity supplied.
D) there will be zero deadweight loss.
B
You might also like to view...
An example of a randomized controlled experiment is when
A) households receive a tax rebate in one year but not the other. B) one U.S. state increases minimum wages and an adjacent state does not, and employment differences are observed. C) random variables are controlled for by holding constant other factors. D) some 5th graders in a specific elementary school are allowed to use computers at school while others are not, and their end-of-year performance is compared holding constant other factors.
Which term describes an especially lengthy and deep recession?
a. peak b. depression c. recession d. trough
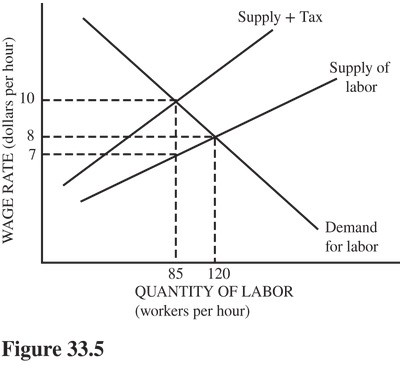 Refer to the labor market in Figure 33.5. Suppose the government imposes a payroll tax on employers. How much of the tax burden is passed on to workers?
A. $8 - $7 = $1 per hour. B. $10 - $7 = $3 per hour. C. $7 per hour. D. $10 - $8 = $2 per hour.
Refer to the information provided in Figure 3.12 below to answer the question(s) that follow.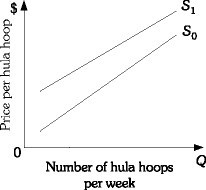 Figure 3.12Refer to Figure 3.12. The supply curve for hula hoops shifts from S0 to S1. This could be caused by
A. a decrease in the demand for hula hoops. B. a decrease in the number of firms selling hula hoops. C. a decrease in the price of hula hoops. D. either B or C.