Refer to the graph shown. Total variable cost of producing Q* is represented by: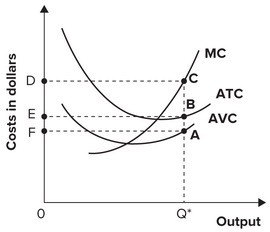
A. area 0Q*CD.
B. area 0Q*BE.
C. area 0Q*AF.
D. cannot be determined.
Answer: C
You might also like to view...
How does an increase in the price level lead to a higher interest rate?
What will be an ideal response?
Suppose that an individual has a constant MRS of shoes for sneakers of 4:3 (that is, he or she is always willing to give up 3 pairs of sneakers to get 4 pairs of shoes). Then, if sneakers and shoes are equally costly, he or she will:
a. buy only sneakers. b. buy only shoes. c. spend his or her income equally on sneakers and shoes. d. wear sneakers only 3/4 of the time.
The industrial revolution began around the year _____.
A. 1650 B. 1750 C. 1850 D. 1950
An individual labor-demand curve represents:
A. the decisions of all firms around how many hours to work at each alternative wage. B. the decisions of all workers around how many hours to work at each alternative wage. C. a worker's decisions around how many hours to work at each alternative wage. D. a firm's decisions around how many hours to hire at each alternative wage.