Write the best-fit linear model for the data.Ten students in a graduate program were randomly selected. Their grade point averages (GPAs) when they entered the program were between 3.5 and 4.0. The following data were obtained regarding their GPAs on entering the program versus their current GPAs. Find a linear function that approximates a student's current GPA as a function of his or her entering GPA.Entering GPACurrent GPA 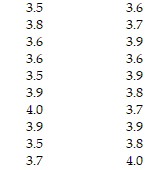
A. y = 2.51 + 0.329x
B. y = 5.81 + 0.497x
C. y = 4.91 + 0.0212x
D. y = 3.67 + 0.0313x
Answer: D
Mathematics
You might also like to view...
Find the derivative at each critical point and determine the local extreme values.y = x(9 - x2)
A. 
B. 
C. 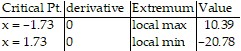
D. 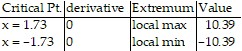
Mathematics
Sketch a graph of the rectangular equation. [Hint: First convert the equation to polar coordinates.]
 figure 1.png)
Mathematics
Translate to an equation. Do not solve.37 is what percent of 85?
A. 37 = p × 85% B. 37% = p × 85 C. 37 = p × 85 D. 37 × p = 85
Mathematics
Plot and interpret the appropriate scatter diagram.The table shows the study times and test scores for a number of students. Draw a scatter plot of score versus time treating time as the independent variable. 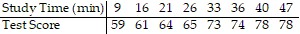

What will be an ideal response?
Mathematics