The graph of 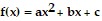 is given in the figure. State whether
  or
or 
A. a < 0
B. a > 0
Answer: A
You might also like to view...
Perform the indicated operations and simplify the result so there are no quotients.
A. 0 B. 1 - sin ? C. 1 D. - sec2?
Analyze the graph of the given function f as follows:(a) Determine the end behavior: find the power function that the graph of f resembles for large values of |x|.(b) Find the x- and y-intercepts of the graph.(c) Determine whether the graph crosses or touches the x-axis at each x-intercept.(d) Graph f using a graphing utility.(e) Use the graph to determine the local maxima and local minima, if any exist. Round turning points to two decimal places.(f) Use the information obtained in (a) - (e) to draw a complete graph of f by hand. Label all intercepts and turning points.(g) Find the domain of f. Use the graph to find the range of f.(h) Use the graph to determine where f is increasing and where f is decreasing.f(x) = (x - 3)(x - 1)(x + 2)
What will be an ideal response?
Solve.x - 2y + 3z = 4y + 3z = 0 z = -2
A. {(-22 , -6, -2)} B. {(-20 , -5, -2)} C. {(20 , 5, -2)} D. {(22 , 6, -2)}
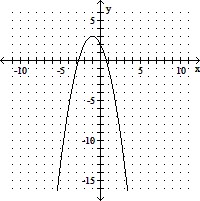
Use the figure to solve the inequality.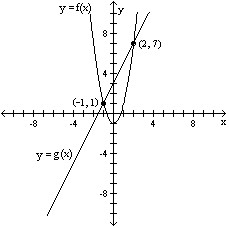 f(x) > g(x)
A. {x|-1 ? x ? 2}; [-1, 2] B. {x|-1 < x < 2}; (-1, 2) C. {x|x ? -1 or x ? 2}; (-?, -1] or [2, ?) D. {x|x < -1 or x > 2}; (-?, -1) or (2, ?)