A histogram or frequency plots is a
a. graphical tool used to understand variability.
b. finished chart which will resemble a bell if the data is in control
c. a chart in which the vertical axis is the frequency and the horizontal axis is the scale of characteristics.
d. chart constructed with a block of data separated into five to twelve bars or sections from low number to high number.
e. all the above
Answer: E
You might also like to view...
In an engineering drawing, the absence of a second arrow on the cutting plane line is an indication that the cutting plane line is for a(n) _________________________.
Fill in the blank(s) with the appropriate word(s).
The field of ____________, which sequences all DNA in environmental samples, has shed light on the possible number of prokaryotic organisms waiting to be studied
Fill in the blank(s) with correct word
A eutectic solution is a(n) ____.
A. phase change solution B. very warm solution C. acid solution D. explosive solution
Refer to Figure P2.64 and determine the equivalent resistance between terminals a and b if terminal c is wired (shorted) to terminal a and terminal d is wired (shorted) to terminal b.
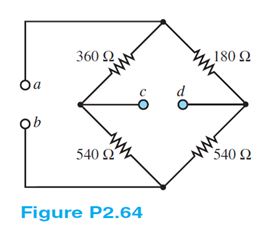
What will be an ideal response?