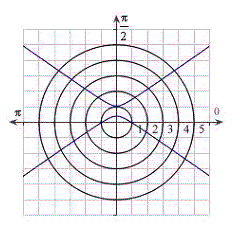
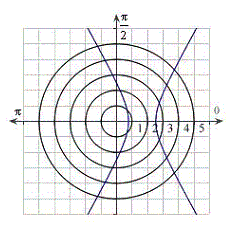
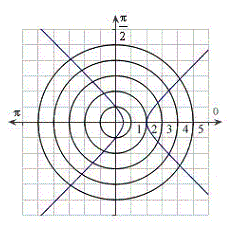
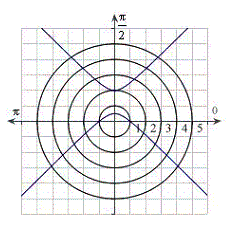
Identify the graph for the polar equation  .
.
?
A. ?
?
B. ?
?
C. ?
?
D. ?
E. ?
?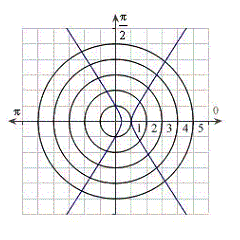
Answer: D
You might also like to view...
Determine the values of x for which the function, as represented by the graph, is continuous. If the function is not continuous, determine the reason.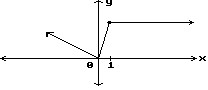
A. Continuous for all x B. Not continuous at x = 1; function not defined C. Not continuous at x = 0; small change Not continuous at x = 1; function not defined D. Not continuous at x = 0, x = 1; function not defined
Present data in the form of tables. For the data set shown by the table, a. Create a scatter plot for the data. b. Use the scatter plot to determine whether an exponential function or a logarithmic function is the best choice for modeling the data.Percentage of Population Living in the South Suburbs of a Large City 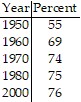
What will be an ideal response?
Convert the angle from radians to degrees.- 
A. 2° B. -90?° C. -90° D. -2°
Find the slope-intercept form of the equation of the line passing through the points. (9, -8), (-5, 7)
 figure 1.png)