The pair of figures is similar. Find the missing side n. Round to the nearest tenth when necessary.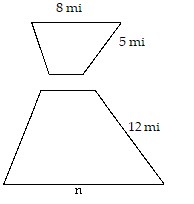
A. n = 19.2 mi
B. n = 3.3 mi
C. n = 480 mi
D. n = 7.5 mi
Answer: A
You might also like to view...
Based on the figure, specify the given set in a simpler way.


![]()
A. 
B. B
C. 
D. 
Determine the coordinates of the focus and the equation of the directrix of the parabola.y2 = -4x
A. F(0, -1), y = 1 B. F(1, 0), x = -1 C. F(-1, 0), y = 1 D. F(-1, 0), x = 1
The graph below indicates the number of new cases of Chalk Dust Disease (CDD) diagnosed each month in the Mathland. Let T(t) represent the total number of new cases per month, F(t) the number of new cases per year among algebraists, G(t) the number of new cases per year among geometers, and t the number of years since January 1, 1990.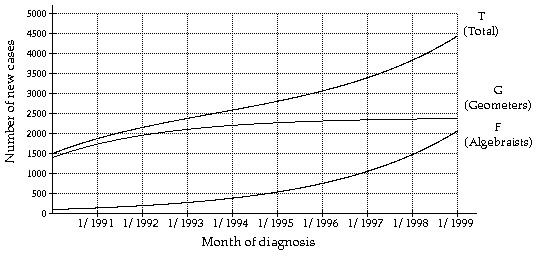 Estimate (T - G)(1) and interpret its meaning.
A. 1900; In January, 1991, there were about 1900 new cases of CDD diagnosed. B. 1700; In January, 1991, there were about 1700 new cases of CDD diagnosed among geometers. C. 140; In January, 1991, there were about 140 new cases of CDD diagnosed among geometers. D. 140; In January, 1991, there were about 140 new cases of CDD diagnosed among algebraists.
Solve the equation and check your solution. =
= 
A. x = ± 11 B. x = 11 C. x = -11 D. No solution