The graph shows the monthly revenue in millions of dollars of a growing company after the company doubled its advertising. Use the graph to solve the problem. 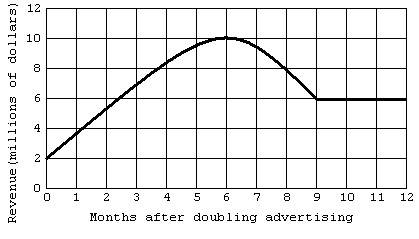 Estimate the minimum revenue during the period of time plotted on the graph.
A. $6 million
B. $4 million
C. $1 million
D. $2 million
Answer: D
You might also like to view...
Find the average value of  over the given region.
 over the rectangular solid in the first octant bounded by the coordinate planes and the planes
  ,
,  ,
, 
A. 
B. 
C. 
D. 
Write the whole number in words.70,146
A. Seven hundred one thousand, forty-six B. Seven thousand, one hundred forty-six C. Seventy thousand, one hundred forty-six D. Seven million, one thousand, forty-six
Solve by the substitution method. = 56x = 10 + 15y
A. 
B. 
C. {(x, y)| = 5}
= 5}
D. ?
Find the Social Security tax (6.2%), Medicare tax (1.45%), and state disability insurance deduction (1%) for the employee. Assume the employee is under the FICA and SDI maximums at the end of the current pay period and assume that  is paid for any overtime in a
  week. Round to the nearest cent if needed. Hours Reg FICA Medicare SDIEmployee Worked Rate Tax Tax TaxHudson, R. 41.94 $7.92
A. $20.59, $4.82, $3.32 B. $21.07, $4.93, $3.40 C. $19.64, $4.59, $3.17 D. $30.89, $7.22, $4.98