Use the figure below to answer the following question.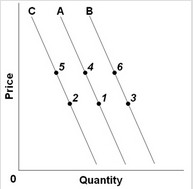 Refer to the three demand curves. An "increase in quantity demanded" caused by a change in price would be illustrated by a change from
A. point 2 to point 5.
B. point 4 to point 6.
C. point 4 to point 1.
D. point 5 to point 1.
Answer: C
You might also like to view...
The optimal level of rights protection is _____
a. zero b. the marginal cost of additional protection equals the market price of the good c. the marginal cost of additional protection equals the marginal benefit of the good d. absolute
If a firm is practicing third-degree price discrimination and is charging a price of $5 per unit to consumers in Group A and a price of $9 to consumers in Group B, which of the following is true?
A) Group A consumers are less responsive to price changes than Group B consumers. B) Group A consumers have a lower price elasticity than Group B consumers. C) Group B consumers have a greater price elasticity than Group A consumers. D) Group A consumers have a greater price elasticity than Group B consumers.
The welfare rolls in the United States shot up most dramatically during the period
A. 1945-1949. B. 1960-1964. C. 1980-1984. D. 1990-1994.
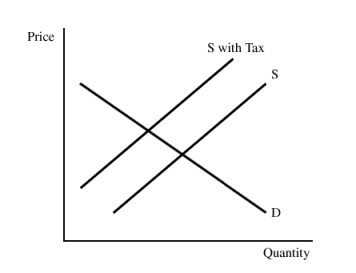 Figure 16.4The pollution tax in Figure 16.4:
A. increases equilibrium output. B. internalizes the pollution externality. C. increases supply. D. All of these