Solve the problem.The chart represents the amount of fuel consumed by a machine used in manufacturing. The machine is turned on at the beginning of the day, takes a certain amount of time to reach its full power (the point at which it uses the most fuel per hour), runs for a certain number of hours, and is shut off at the end of the work day. The fuel usage per hour of the machine is represented by a periodic function. When does the machine first reach its full power?
A. After 2 hours
B. After 14 hours
C. After 4 hours
D. After 7 hours
Answer: A
You might also like to view...
Use the graph of the function f(x) to locate the local extrema and identify the intervals where the function is concave up and concave down.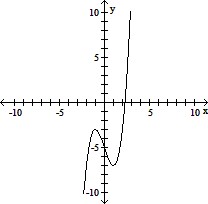
A. Local minimum at x = 1; local maximum at x =-1; concave down on (0, ?); concave up on (-?, 0) B. Local maximum at x = 1; local minimum at x =-1; concave up on (0, ?); concave down on (-?, 0) C. Local maximum at x = 1; local minimum at x =-1; concave up on (-?, ?) D. Local minimum at x = 1; local maximum at x =-1; concave up on (0, ?); concave down on (-?, 0)
Perform the operation and give the answer in the same numeration system. Write the answer as simply as possible.Add ![]() and
and ![]()
A. ![]()
B. ![]()
C. ![]()
D. ![]()
Provide an appropriate response.In a simplex table that gives an optimum solution, a zero indicator for a nonbasic variable suggests
A. the problem has an unbounded solution. B. there is a possibility for multiple optimum solutions. C. a degenerate BFS will occur.
Add. Write the answer in lowest terms. +
+ 
A. 
B. 
C. 
D. 