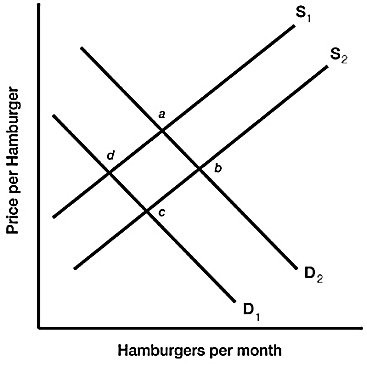
 Figure 3.6 illustrates a set of supply and demand curves for hamburgers. An increase in demand and an increase in quantity supplied are represented by a movement from:
A. point b to point a.
B. point c to point d.
C. point d to point a.
D. point b to point d.
Answer: C
You might also like to view...
Which of the following is an example of fiat money?
A) a cowry shell used as money on a South Pacific island B) a gold coin used as money in nineteenth century England C) a Federal Reserve Note used as money in the twenty-first century United States D) a pound of salt used as money in medieval France
Using the expectations hypothesis on the term structure of interest rates, explain the relationship between the interest rate on a one-year Treasury bond and the interest rate on a two-year Treasury bond
What will be an ideal response?
If the market demand elasticity is constant at -3 and a monopolist's MPL = 1.2L-0.5, then the labor demand for the monopoly is
A) 0.8PL-0.5. B) 0.4PL-0.5. C) 0.8PL-2. D) 0.4PL-2.
Market power is defined as:
(a) The ability of a perfectly competitive firm to charge any price it wants. (b) The strength of the equilibrium in the market. (c) The ability of a seller to affect the market price of a good or service. (d) All of the above.