Draw a sketch to represent the vector. Refer to the vectors pictured here. 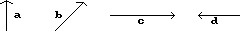 d - a
d - a
A. ![]()
B. ![]()
Answer: A
You might also like to view...
The following table shows the value V, in dollars, of a stamp collection after t years. t 0 1 2 3 V $323.00 $345.61 $369.80 $395.69? A: Make a table of successive ratios to show that the value of the stamp collection can be modeled by an exponential function. Round your answer to two decimal places.B: Find an exponential model for the data. Round your answer to two decimal places.C: Plot the graph of the data points along with the exponential model. Include up to 10 years.D: According to the model, what is the percentage increase in the value of the collection over a 4.00-year period? Round your answer to two decimal places.
What will be an ideal response?
Write the following as an algebraic expression in u, u > 0.sin 
A. 
B. 
C. 
D. u
Solve the equation.5(2n - 2) = 9(n + 3)
A. -17 B. 17 C. 37 D. 22
Write the expression in standard form.
A. 7 - 7i
B. 7 - 
C. 7 - i
D. 7 - 