Which of the following provide a visual model of how inputs, activities, and outputs of a process are linked and are the most fundamental of all process design and process improvement tools?
A) process maps
B) control charts
C) Six Sigma
D) run charts
A
You might also like to view...
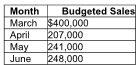
Cost of goods sold is budgeted at 40% of sales, and the inventory at the end of February was $34,000. Desired inventory levels at the end of each month are 10% of the next month's cost of goods sold. What is the desired beginning inventory on June 1?
Seaworthy Company, a merchandising company, has prepared the following sales budget:
A) $24,800
B) $9640
C) $96,400
D) $9920
In a service business, the customer and the front-line service employee interact to co-create the service
Indicate whether the statement is true or false
For a multiple regression model the following statistics are given: Total variation in y = 250, SSE = 50, k = 4, and n = 20 . Then, the coefficient of determination adjusted for the degrees of freedom is:
a. 0.800 b. 0.747 c. 0.840 d. 0.775
A least squares regression line
A. can be used to predict a value of y if the corresponding x value is given. B. implies a cause-and-effect relationship between x and y. C. can only be determined if a good linear relationship exists between x and y. D. ensures that the predictions of y outside the range of the values of x are valid.