The graph of a linear function f is shown. Identify the slope.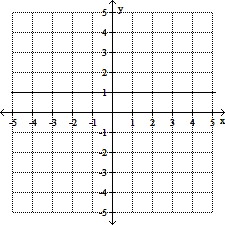
A. 1
B. 0
C. -1
D. Undefined
Answer: B
You might also like to view...
Solve the equation. Use a calculator where appropriate. If the answer is irrational, round to the nearest hundredth.log2 (20 - 4x) = 3
A. 
B. - 
C. -3
D. 3
Write the decimal in words.-0.049
A. negative forty-nine hundred-thousandths B. negative forty-nine ten-thousandths C. negative forty-nine thousandths D. negative forty-nine hundredths
Present data in the form of tables. For the data set shown by the table, a. Create a scatter plot for the data. b. Use the scatter plot to determine whether an exponential function or a logarithmic function is the best choice for modeling the data.Percentage of Population Living in the South Suburbs of a Large City 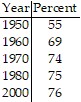
What will be an ideal response?
Divide using long division.
A. 3x - 4
B. 3x + 4 + 
C. 3x - 4 - 
D. 3x - 4 + 