A bar chart would be particularly useful for
A) illustrating what percentages of a company's monthly budget are spent on utilities and other expenses.
B) comparing market shares of three breakfast cereals from 2011 to 2012.
C) showing the stages in production of a jet engine.
D) depicting the proportion of advertising dollars spent on various major media.
E) showing how the marketing budget has changed since 2014.
Answer: B
Explanation: B) Bar charts are useful for showing quantities over time, instead of parts of a whole, processes, or proportions.
You might also like to view...
Differentiate between the cultural and marketing values of Westerners and Asians
What will be an ideal response?
In a low-networked structure, the quantity and magnitude of externally networked activities are limited.
Indicate whether the statement is true or false.
What should be the formula in B5?
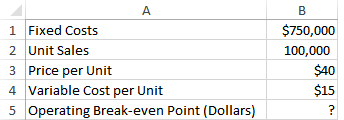
a) =B1/(B3-B4)/B3
b) =B1/B3-B4*B3
c) =(B1/B3)-B4*B3
d) =B1/(B3-B4)*B3
e) =B1/(B3+B4)*B3
[The following information applies to the questions displayed below.]On January 1, Year 1, Pierce Corporation issued $25,000 in 8%, 5-year bonds payable at 102. Interest payments are due each December 31. Pierce uses the straight-line method to amortize bond discounts and premiums.Which of the following shows the effect of the interest payment and amortization on December 31, Year 1? Assets=Liab.+Stk.EquityRev.?Exp.=Net Inc.Stmt. ofCash FlowsA.(2,000)=(160)+(1,840)(1,840)?NA=(1,840)(2,000)FAB.(2,000)=(100)+(1,900)NA?1,900=(1,900)(100)FA/(1,900)OAC.(2,000)=(100)+(1,900)NA?1,900=(1,900)(2,000)OAD.(2,000)=NA+NANA?NA=NA(2,000)OA
A. Option A B. Option B C. Option C D. Option D