Graph.y ? 
A. 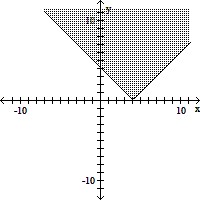
B. 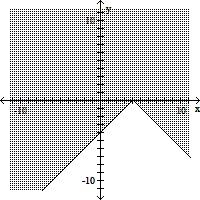
C. 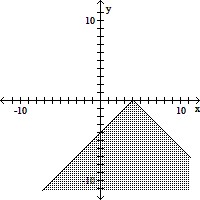
D. 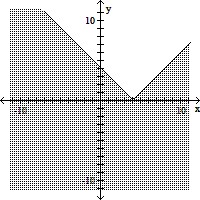
Answer: D
Mathematics
You might also like to view...
Use the graph to answer the question. Mike decides to buy shares of companies A, B, and C, which were initially selling for the same price. The changes in each stock's value are shown in the graph above. After how many days did stock C's value go below
A. 60 B. 80 C. 40 D. 30
Mathematics
Provide an appropriate response.Divide: 
A. 7x + 9y B. 5x + 7y C. 7x - 9y D. 5x - 7y
Mathematics
Provide an appropriate response.Determine the general term of the sequence 5, -  ,
,  , -
, -  , . . . .
A. an = 5 n-1
n-1
B. an = -5 n-1
n-1
C. an = 5 n
n
D. an =  (5)n-1
Mathematics
Evaluate the factorial expression.
A. 
B. 
C. 
D. 
Mathematics