Refer to the graph shown. Areas C and D represent: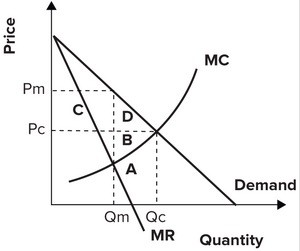
A. the loss of surplus by producers resulting from a monopoly.
B. consumer surplus redistributed to the monopolist.
C. the cost to society of increasing output from Qm to Qc.
D. the loss of surplus by consumers resulting from a monopoly.
Answer: D
You might also like to view...
The above figure shows the U.S. market for wheat. With international trade, consumer surplus is equal to ________
A) area A + area B + area C B) area E + area F C) area B + area C + area D D) area A + area B + area C + area D E) area A
Which of the following is NOT given in the video as an example of a real shock?
A. high inflation B. bad weather C. wars D. changes in the price of oil
Compute the expected return, standard deviation, and value at risk for each of the following investments:Investment (A): Pays $800 three-fourths of the time and a $1,200 loss otherwise.Investment (B): Pays $1,000 loss half of the time and a $1,600 gain otherwise.State which investment will be preferred by each of the following investors, and explain why.(i) a risk-neutral investor(ii) an investor who seeks to avoid the worst-case scenario.(iii) a risk-averse investor.
What will be an ideal response?
A new technology is developed for producing microwave ovens that reduces production costs by 10%. Which of the following is the most likely consequence of this technological change?
A. Firms will continue to operate efficiently as long as no firm adopts this new technology. B. Firms must adopt this new technology to remain efficient. C. If firms do not adopt this new technology, then the economy will remain in general equilibrium, because firms will not change their price and output decisions. D. This new technology will not affect efficiency, but it will change the equilibrium price and quantity for this industry.